Mountain Permafrost Extent
Traditionally permafrost is defined as any subsurface material (e.g., rock, sediment, organics) that remains at or below 0 °C for a minimum of two years. As a massive reservoir of carbon, high latitude permafrost has been a key research topic because of its potential to accelerate climate change (Schuur et al., 20156; Cheng et al., 20221). Permafrost thaw will also have major consequences for local to regional hydrology due to changing subsurface flow paths and storage (Walvoord & Kurylyk 2016)9. However, research on mountain permafrost in general has been limited, especially beyond the extent of the Tibetan Plateau, due to challenging environmental conditions at high altitudes with complex topography. Thus, a need exists for studies that not only quantify but also characterize uncertainty related to mountain permafrost extent.
Remotely sensed daily surface temperature products (e.g., MODIS) offer one solution for the continued monitoring and estimating of difficult-to-access permafrost regions. However, frequent cloud cover in such regions hamper accurate long-term temperature estimates of the ground. Furthermore, local variables like seasonal snow cover, vegetation, and soil moisture cause temperature offsets between the land surface and at depth (e.g., the permafrost table), which may lead to either under- or over-estimation of the climatological mean annual ground temperature (MAGT).
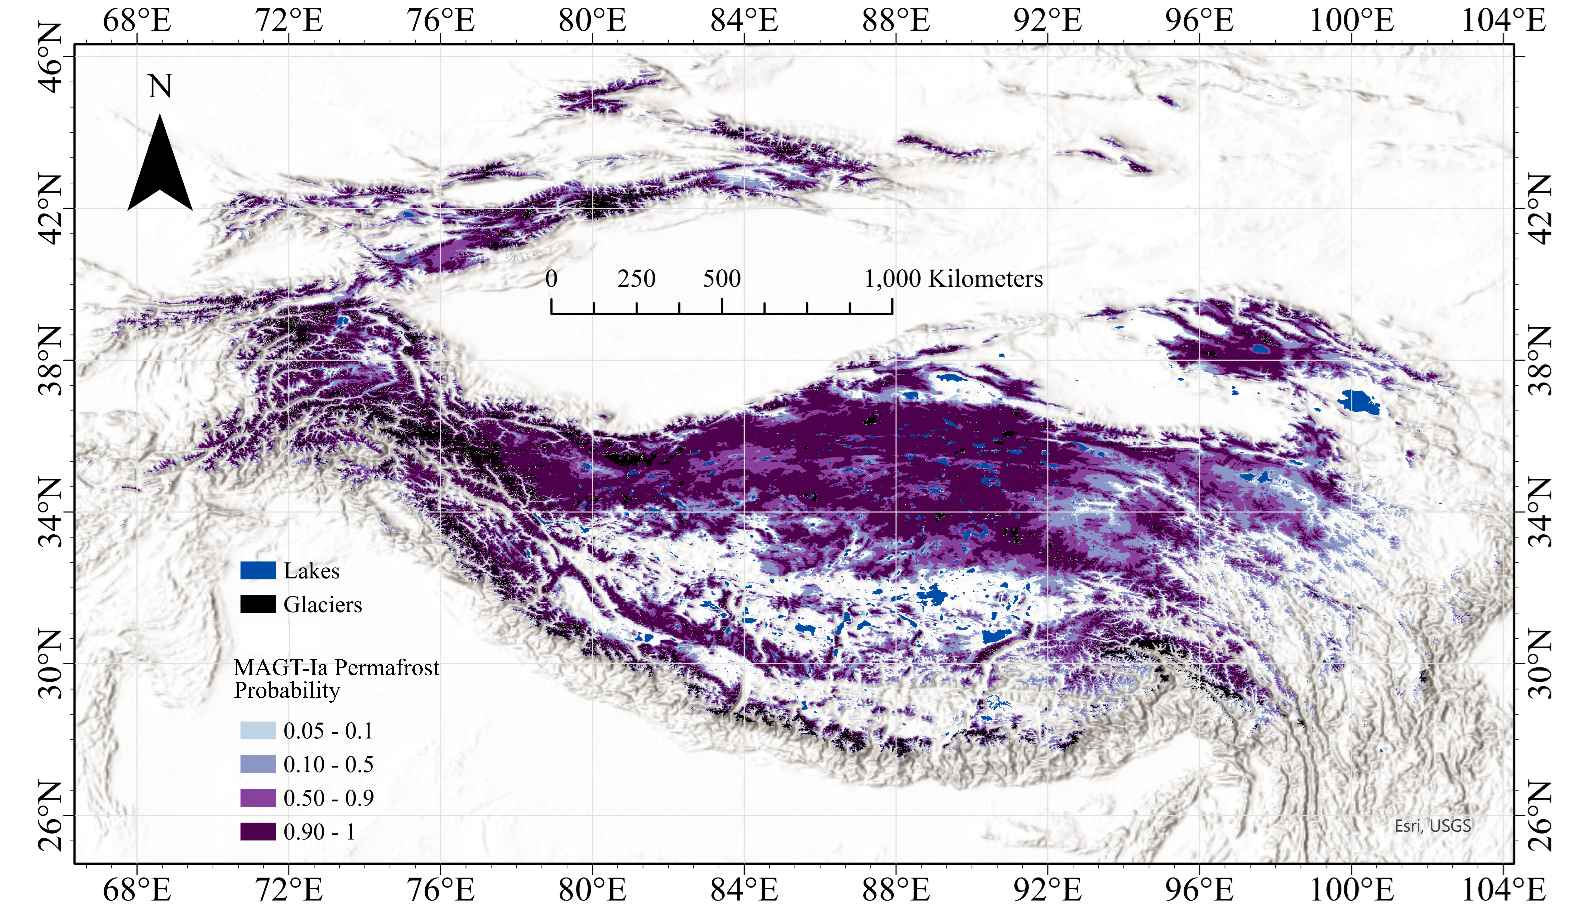
This recently published study by Kim et al. (2024)3 leverages skin temperature products from AIRS which have undergone a cloud-clearing algorithm to gap-fill missing data to generate a MAGT (2003 – 2016) solely based on remotely sensed products (Susskind et al., 2014). Additional MAGT estimates are generated using insulating nival factors, thermal conductivity ratios based on modeled soil moisture products, and the temperature-at-top-of-permafrost (TTOP) equation from Smith & Riseborough (2002)7 to compare against established permafrost (probability) maps from Gruber (2012)2, Obu et al. (2019)4, and Ran et al. (2022)5. This study found that across the probability maps, the central and eastern regions of HMA had the greatest variance in permafrost regional areas; however, the MAGT calculated from MODIS and AIRS alone matched the closest to the MAGT fitted to in situ borehole data with a machine learning architecture. This may suggest that long-term satellite-based surface temperatures can monitor permafrost temperatures at depth, given robust gap-filling methods.
Data products (e.g., permafrost maps, gap-filled monthly surface temperature) are currently being reviewed through NSIDC (10.5067/ZSRHP8H3GGSK) prior to public availability. Codes used to process data and produce figures are available through the first author’s Github account.
References
Cheng, F., Garzione, C., Li, X., Salzmann, U., Schwarz, F., Haywood, A.M., Tindall, J., Nie, J., Li, L., Wang, L., Abbott, B.W., Elliott, B., Liu, W., Upadhyay, D., Arnold, A., Tripati, A., 2022. Alpine permafrost could account for a quarter of thawed carbon based on Plio-Pleistocene paleoclimate analogue. Nat Commun 13, 1329.↩
Gruber, S., 2012. Derivation and analysis of a high-resolution estimate of global permafrost zonation. The Cryosphere 6, 221–233.↩
Kim, K.Y., Haagenson, R., Kansara, P., Rajaram, H., Lakshmi, V., 2024. Augmenting daily MODIS LST with AIRS surface temperature retrievals to estimate ground temperature and permafrost extent in High Mountain Asia. Remote Sensing of Environment 305, 114075.↩
Obu, J., Westermann, S., Bartsch, A., Berdnikov, N., Christiansen, H.H., Dashtseren, A., Delaloye, R., Elberling, B., Etzelmüller, B., Kholodov, A., Khomutov, A., Kääb, A., Leibman, M.O., Lewkowicz, A.G., Panda, S.K., Romanovsky, V., Way, R.G., Westergaard-Nielsen, A., Wu, T., Yamkhin, J., Zou, D., 2019. Northern Hemisphere permafrost map based on TTOP modelling for 2000–2016 at 1 km2 scale. Earth-Science Reviews 193, 299–316.↩
Ran, Y., Li, X., Cheng, G., Che, J., Aalto, J., Karjalainen, O., Hjort, J., Luoto, M., Jin, H., Obu, J., Hori, M., Yu, Q., Chang, X., 2022. New high-resolution estimates of the permafrost thermal state and hydrothermal conditions over the Northern Hemisphere. Earth System Science Data 14, 865–884.↩
Schuur, E. a. G., McGuire, A.D., Schädel, C., Grosse, G., Harden, J.W., Hayes, D.J., Hugelius, G., Koven, C.D., Kuhry, P., Lawrence, D.M., Natali, S.M., Olefeldt, D., Romanovsky, V.E., Schaefer, K., Turetsky, M.R., Treat, C.C., Vonk, J.E., 2015. Climate change and the permafrost carbon feedback. Nature 520, 171–179.↩
Smith, M.W., Riseborough, D.W., 2002. Climate and the limits of permafrost: a zonal analysis. Permafrost and Periglacial Processes 13, 1–15.↩
Susskind, J., Blaisdell, J.M., Iredell, L., 2014. Improved methodology for surface and atmospheric soundings, error estimates, and quality control procedures: the atmospheric infrared sounder science team version-6 retrieval algorithm. JARS 8, 084994.↩
Walvoord, M.A., Kurylyk, B.L., 2016. Hydrologic Impacts of Thawing Permafrost—A Review. Vadose Zone Journal 15, vzj2016.01.0010.↩