MATCHA (Model for Atmospheric Transport and Chemistry in Asia)
The MATCHA dataset has been published at NSIDC: https://nsidc.org/data/hma2_matcha/versions/1
The overarching question driving the HiMAT-2 Aerosols Subgroup is “What are the impacts of aerosols on the cryosphere and their interactions in High Mountain Asia?”. Within that question, we consider the following:
- What are the relative contributions of light-absorbing particles/LAPs (black carbon, brown carbon, and dust) to atmospheric and snow-mediate radiative forcing and albedo reduction in High Mountain Asia (HMA)?
- What are the relative contributions of emissions from different sources (anthropogenic and wildfire emissions, and long-range transport) and source regions (e.g., different Asian countries) to LAP concentration and deposition in HMA?
- How has LAP deposition over HMA affected snowmelt, runoff characteristics, and water resources in downstream Asian regions over the past two decades?
The Aerosol subgroup is tackling these questions by
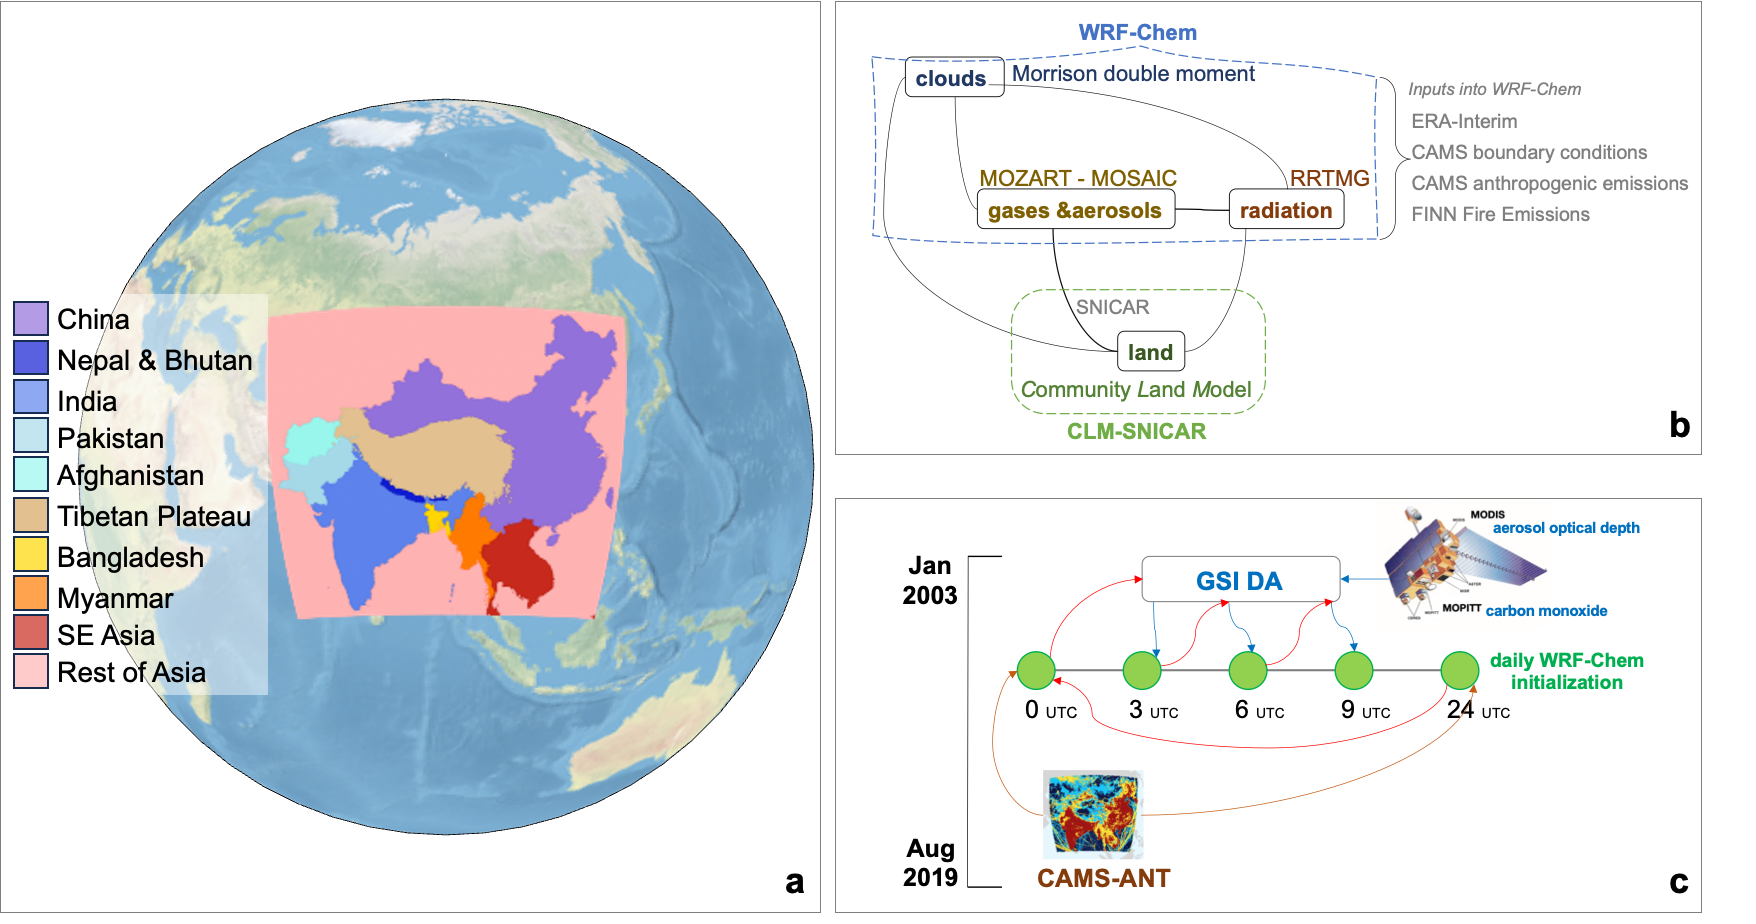
- Simulating a long-term high-resolution reanalysis of concentration and deposition of LAPs using a fully coupled regional chemistry-climate model (WRF-Chem) over Asia from January 2003 to August 2019 (See Figure 1).
- Constraining the concentration and deposition of LAPs by assimilating MODIS AOD and MOPITT CO NASA satellite retrievals daily into WRF-Chem simulations.
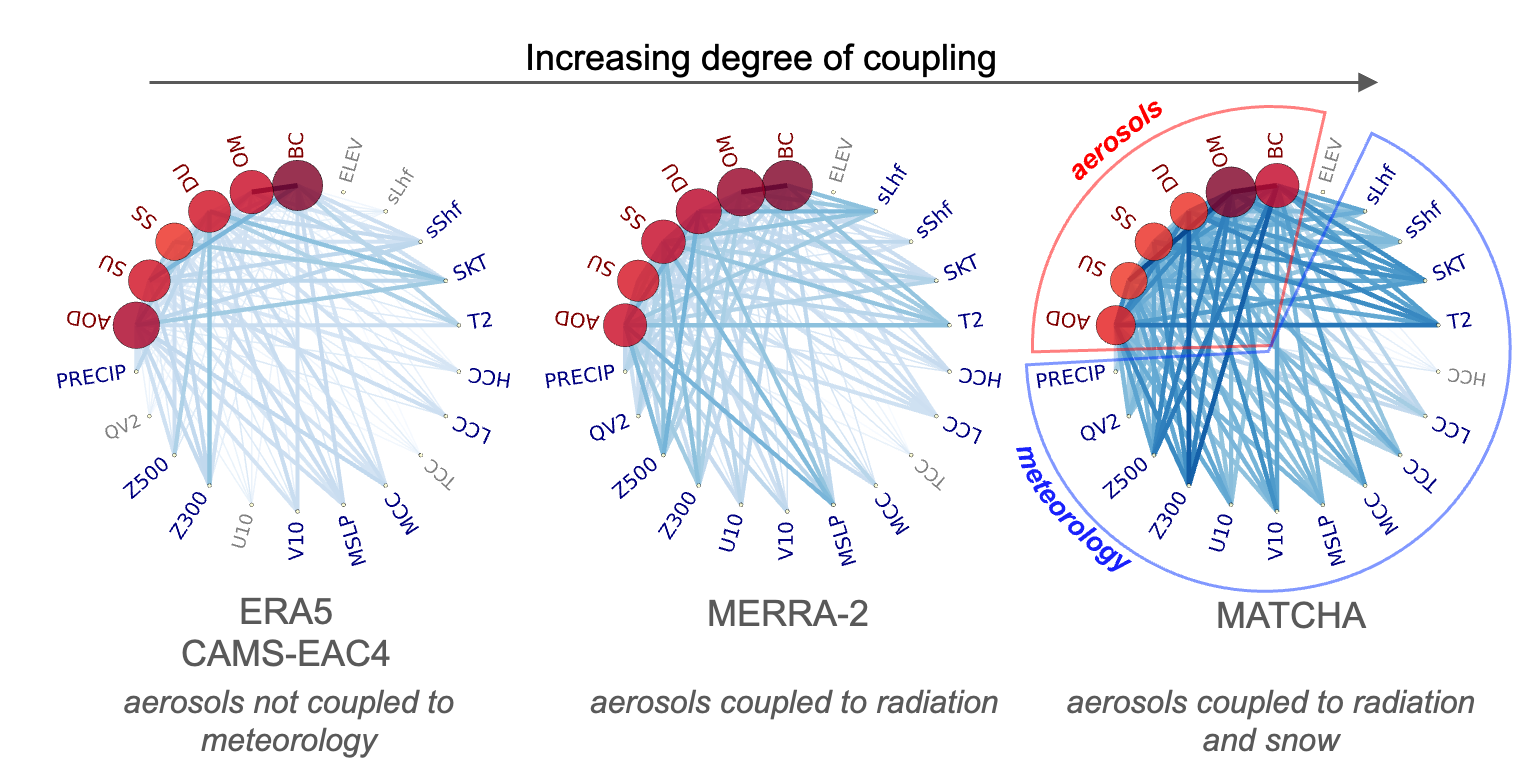
- Implementing the interactions among LAPs, radiation, and snow within WRF-Chem to allow for a strongly coupled simulation of all relevant processes driving the cryosphere in HMA (See Figure 2).
- Implementing brown carbon aerosols, their deposition, and their interactions with radiation and snow into WRF-Chem.
- Implementing a tagged-tracer method to track anthropogenic BC from 10 Asian regions and quantifying their contribution to LAP concentration and deposition over HMA.
- Quantifying the effects of LAP deposition on snow properties and its associated hydrological impacts (runoff and streamflow characteristics) over river basins in HMA.
The output of these simulations from NCAR’s team is a strongly coupled (considering aerosol-snow-radiation interactions) regional reanalysis dataset over HMA for 16 years (2003-2019) with hourly to three-hourly model outputs. The dataset is named as MATCHA, Model for Atmospheric Transport and Chemistry in Asia.
Currently, we are in the process of evaluating the MATCHA reanalysis data across four main areas,
- Chemistry: Evaluate particulate matter (2.5 and 10 um), aerosol optical depth, single scattering albedo, and black carbon concentration and their deposition across available in-situ observations from ground and satellites. We also plan to assess the uncertainty in anthropogenic BC emissions used as input in WRF-Chem through ground-based BC observations using inverse modeling.
- Meteorology: Evaluate surface meteorology, boundary layer properties, and vertical profiles from surface observations and radiosonde profiles.
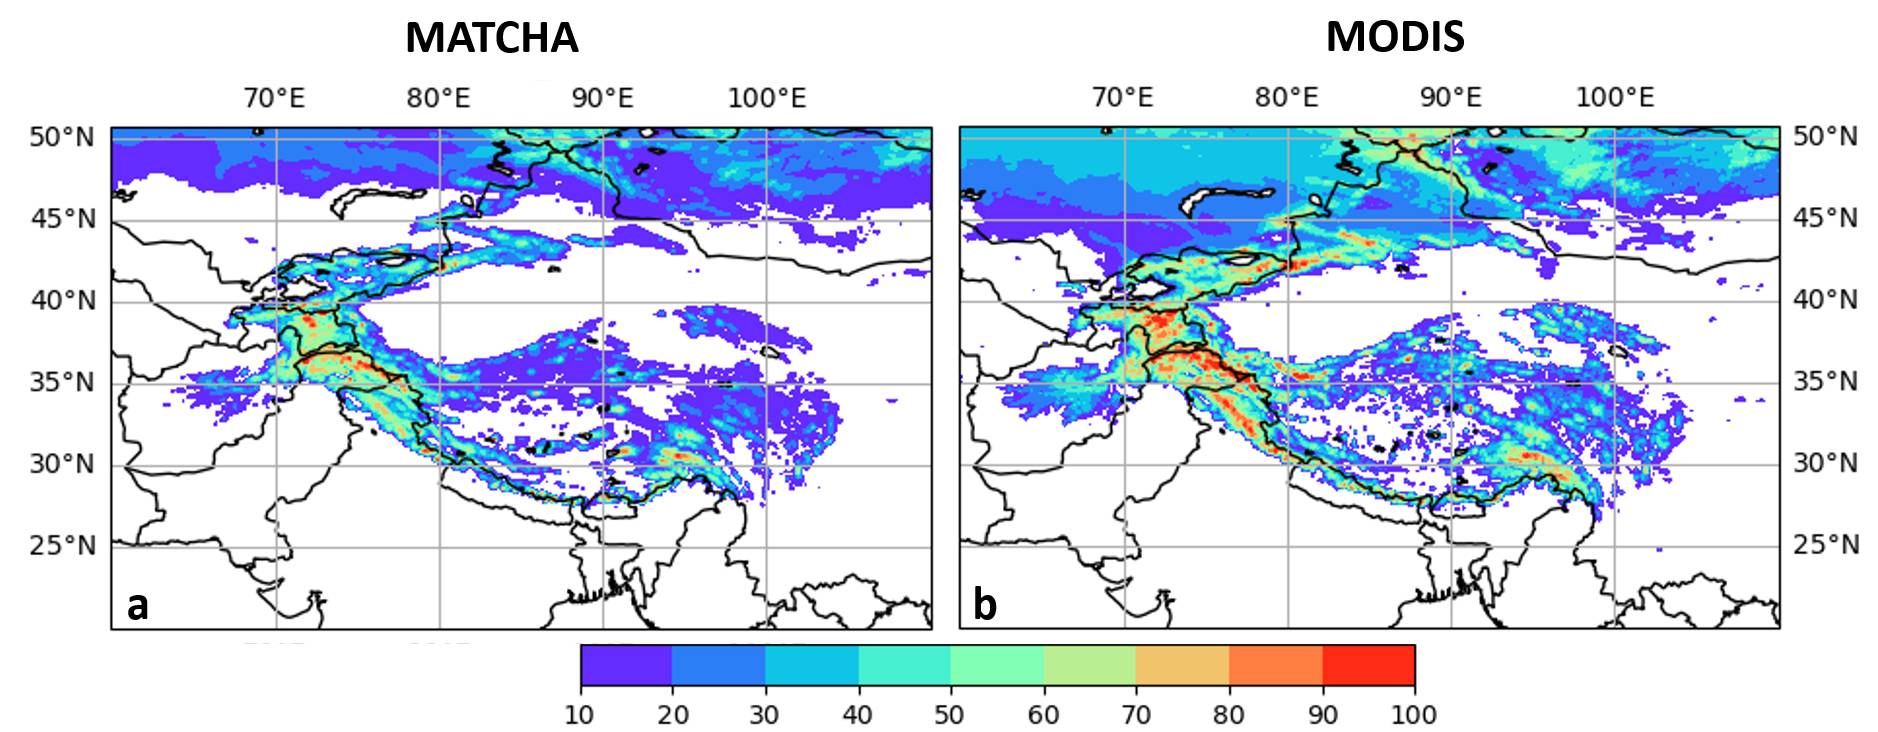
- Land: Evaluate snow properties using the data from the Snow sub-group (led by K. Rittger) and other available satellite observations (Fig. 3)
- Hydrology: Evaluate streamflow from measurements over the Brahmaputra and Ganges River basins, and global estimates for other watersheds in China.